Researching Measles Vaccination Data in the United States
1. What is this data area?
Figure 1.1 - Annual measles cases in the USA (1944-2019), showing the drop after the 1963 vaccine and the recent rise.
Source: CDC measles data page
Measles vaccination data sits at the crossroads of two datasets that public health agencies publish every year:
- Vaccination coverage - the percentage of children (usually kindergarteners) who have received two doses of the MMR (measles, mumps, rubella) vaccine, reported by state, county and sometimes school district.
- Exemption rates - the percentage of children legally allowed to opt out of school-required vaccines for personal, philosophical or religious reasons (a "conscientious exemption").
- Outbreak outcomes - confirmed cases, hospitalizations and deaths, the vaccination status of the people affected, and the attack rate (cases per 100,000 residents).
- Response data - how many vaccination and testing clinics were held and how many doses were actually given during an outbreak.
The historical context matters when reading the numbers. Before 1963 measles was universal and infected 1-2 million Americans a year. Two vaccines arrived in 1963, an improved version came out in 1968, the combined MMR vaccine followed in 1971, and in 2000 measles was declared eliminated from domestic transmission in the US. In the 2024-25 school year, national kindergarten MMR coverage fell from 95.2% to 92.5%, below the level (about 95%) that stops outbreaks from spreading.
A motivated consumer can therefore ask questions like: Is my county above or below 95%? How fast is the exemption rate rising? When an outbreak hits, who actually gets hospitalized? Is the problem a lack of vaccine supply or a lack of trust? The rest of this page shows where to find the answers.
2. Web resources for measles vaccination data
Three diverse sources are listed below: a medical news site (trend reporting), the federal public health agency (primary outbreak data), and a local investigative newsroom (county-level case studies). Together they cover national, state and local views of the same problem.

Resource 1: Healio (Pediatrics news)
Page: "US kindergarten vaccination rates decline again";
Link:
healio.com/news/pediatrics/20250801/us-kindergarten-vaccination-rates-decline-again
Best for: the national trend in kindergarten MMR coverage and exemption rates, summarized from CDC school-survey data in plain language.
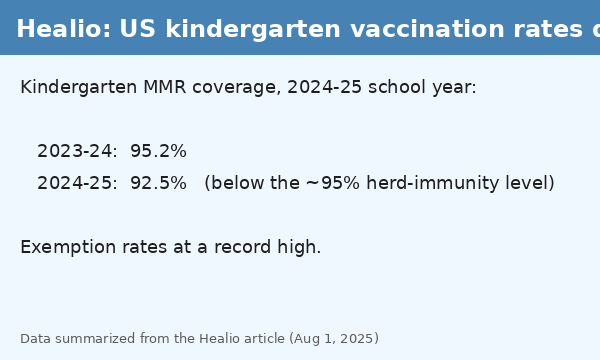
Figure 2.1 - Healio's summary of kindergarten coverage falling from 95.2% to 92.5% and exemptions rising.
View the article
Use this site first to understand the direction of the data. It answers "is coverage going up or down nationally?" and links back to the underlying CDC survey, so you can verify every number.

Resource 2: CDC - Morbidity and Mortality Weekly Report (MMWR)
Page: MMWR report on the 2025 Southwest measles outbreak (Texas hospitalizations)
Link:
cdc.gov/mmwr/volumes/75/wr/mm7520a1.htm
Best for: primary outcome data - confirmed cases, hospitalizations, deaths, and the vaccination status of each group.
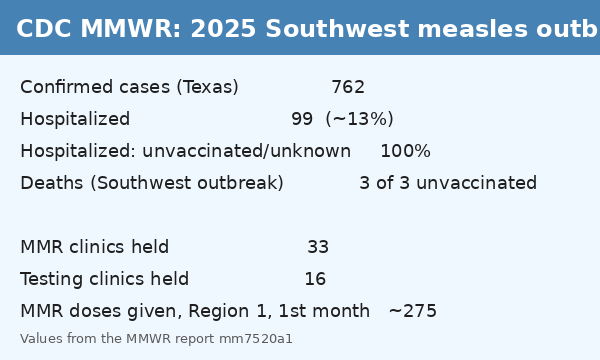
Figure 2.2 - MMWR data table: 762 confirmed cases, 99 hospitalized (about 13%), all hospitalized patients unvaccinated or of unknown status.
View the report
MMWR articles are dense, but every table is labelled and every figure has a methods note. This is where you confirm the severity numbers: 100% of hospitalized patients were unvaccinated or of unknown status, and 3 of 3 deaths across the Southwest outbreak were in unvaccinated people.

Resource 3: KXAN Investigates - "Vaccine Divide"
Page: Vaccine Divide (interactive Texas county data)
Link:
kxan.com/investigations/vaccine-divide/
Best for: county-level comparisons - coverage, exemption rate, population and cases side by side for Texas counties.
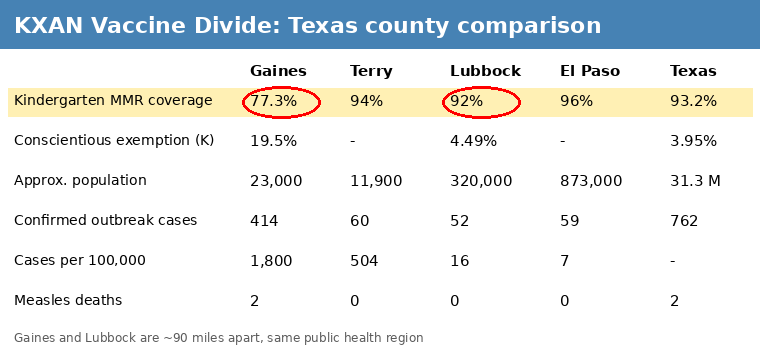
Figure 2.3 - KXAN county map. Gaines County (77.3% coverage) is highlighted next to Lubbock County (94%), about 90 miles away.
View the interactive
Local newsrooms turn the state exemption spreadsheets into maps and sortable tables. Use this site to find the two or three counties you want to compare, then go back to the CDC to get the outcome numbers for those counties.
3. What insights can a consumer get from this data?
Here are four goals a motivated reader might have, and which resource answers each one.
Goal A: "Is my community protected?"
Use KXAN to look up your county's kindergarten MMR coverage. Compare it to the 95% herd-immunity threshold explained on Healio. Anything under about 92% puts your county in the group that produces 88% of large outbreaks.
Goal B: "Is the trend getting better or worse?"
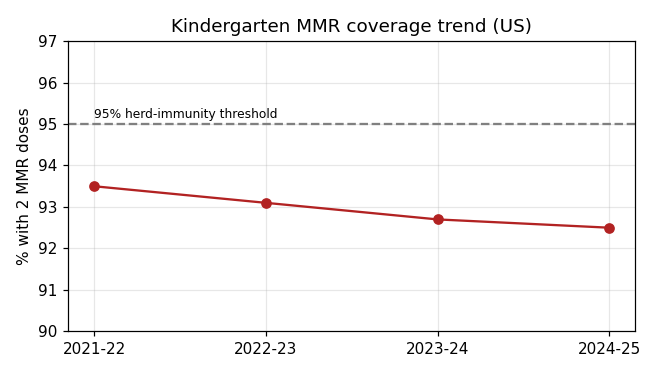
Healio reports the year-over-year change (95.2% to 92.5% for 2024-25). Follow the link in the article to the CDC school survey to get the full multi-year series and your own state's line.
Goal C: "How serious is measles if an outbreak happens?"
The CDC MMWR report gives hospitalization and death counts by vaccination status. In the 2025 outbreak roughly 13% of confirmed cases (99 of 762) were hospitalized, and unvaccinated people face roughly 50 times the risk of infection after exposure compared with people who have had two doses.
Goal D: "Is this a supply problem or a trust problem?"
Combine the CDC response numbers (33 vaccination clinics and 16 testing clinics held in the region) with the doses actually given (around 275 MMR doses in Region 1 in the first month). Plenty of clinics but few doses points to a trust problem, not a supply issue - an insight you cannot see from any one number alone.
4. Sample analysis: comparing four Texas counties
This walkthrough shows how to use all three resources together to answer one question: Why did Gaines County have such a severe outbreak while El Paso, with a much larger population, did not?
Step 1 - Pull the coverage numbers (KXAN)
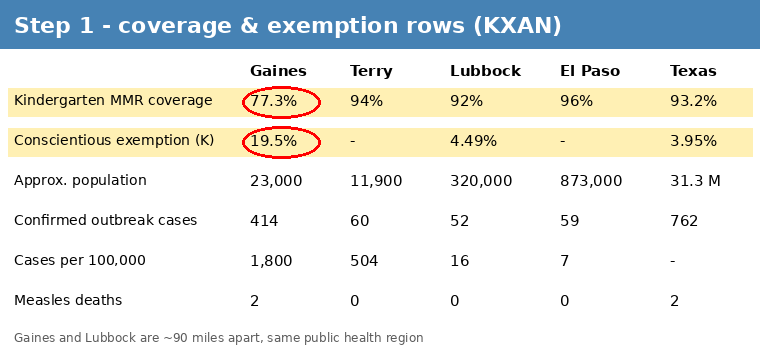
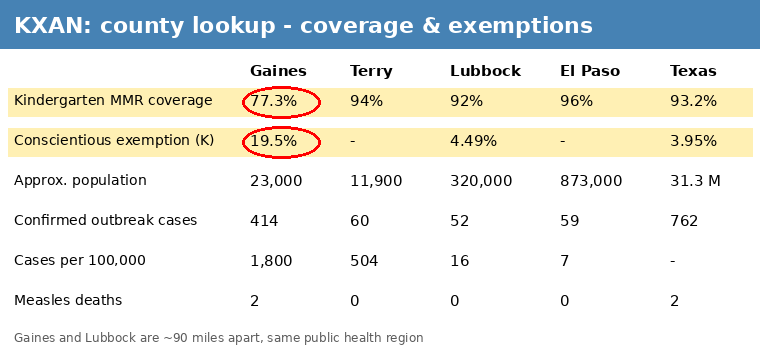
Figure 4.1 - KXAN county table with the four counties highlighted. Gaines: 77.3% coverage, 19.5% exemptions.
View the source
On the KXAN Vaccine Divide page, search for Gaines, Terry, Lubbock and El Paso counties. Write down kindergarten MMR coverage and the conscientious exemption rate. Notice that Gaines (77.3%) and Lubbock (94%) are only about 90 miles apart and sit in the same public health region, yet are separated by nearly 17 percentage points.
Step 2 - Pull the outcome numbers (CDC MMWR)
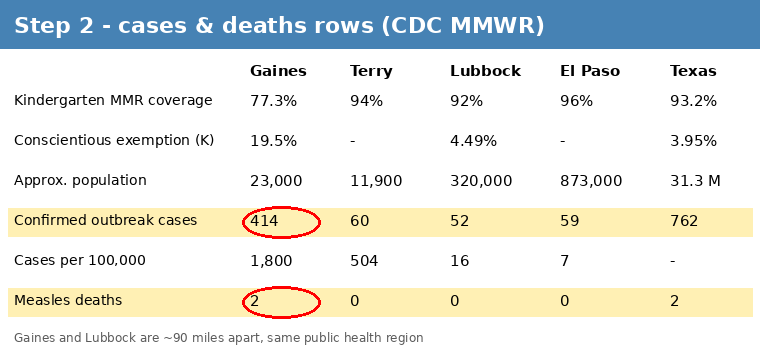
From the MMWR report, record confirmed cases and deaths for the same counties. Then divide cases by population and multiply by 100,000 to get an attack rate you can compare fairly between a 23,000-person county and an 873,000-person county.
Step 3 - Put it in one table
| Gaines | Terry | Lubbock | El Paso | Texas | |
|---|---|---|---|---|---|
| Kindergarten MMR coverage | 77.3% | 94% | 92% | 96% | 93.2% |
| Conscientious exemption rate (K) | 19.5% | - | 4.49% | - | 3.95% |
| Approx. population | 23,000 | 11,900 | 320,000 | 873,000 | 31.3 M |
| Confirmed outbreak cases | 414 | 60 | 52 | 59 | 762 |
| Cases per 100,000 residents | 1,800 | 504 | 16 | 7 | - |
| Measles deaths | 2 | 0 | 0 | 0 | 2 |
Red cells mark the values that stand out. Data compiled from the KXAN, CDC MMWR and Healio sources listed above.
Step 4 - Draw the insight
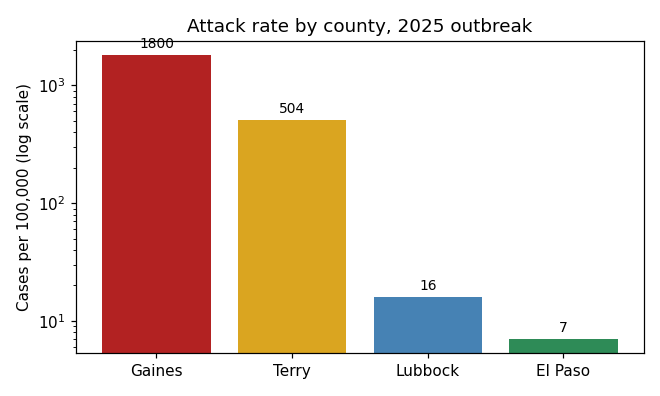
Figure 4.3 - Cases per 100,000 residents on a log scale: 1,800 / 504 / 16 / 7. The gap is so large a normal axis would hide the smaller bars.
Data source
Gaines County's attack rate is about 110 times Lubbock's and about 260 times El Paso's. The only column that moves in the same direction is vaccination coverage: as coverage falls from 96% to 77%, cases per 100,000 rise from single digits to the thousands. Population size does not explain it - the largest county had the fewest cases per person.
Add the severity data from Step 2 (all hospitalized patients unvaccinated or of unknown status; all deaths in unvaccinated people) and the response data (33 clinics, about 275 doses given) and the conclusion a consumer can reach is: the outbreak concentrated where exemptions were highest, and the limiting factor was willingness to vaccinate, not access to vaccine.
Step 5 - Check the national picture (Healio)
Finally, go back to Healio to see whether Gaines County is an outlier or a preview. National kindergarten coverage has dropped below 93% and exemptions are at record highs, so the pattern seen in West Texas is the pattern to watch for in any county where coverage slips under about 92%.
Sources used: Healio - kindergarten vaccination rates decline | CDC MMWR - Southwest measles outbreak | KXAN - Vaccine Divide | Claud for Figure 4.3 and most text summaries on Page